Monday, April 30, 2012

Never trust an infographic over 30

I've been tinkering with improving my data visualization skills recently, as I'm sick of using nothing but Excel (although if you want to continue using Excel for everything, this is a pretty useful website).

As anyone who takes a look around the interweb can tell you though, there is a pretty insidious type of data visualization that's been flooding our society.

Oh yes, I'm talking about the infographic.

While sometimes these are endearing and amusing, they are often terrible, misleading and ridiculous.  I was going to formulate some thoughts on why they were terrible, and then I found out that Megan McArdle already had in a column for the Atlanic.  It's a pretty good read with lots of pictures.  Her summation at the end pretty much says it all:


If you look at these lovely, lying infographics, you will notice that they tend to have a few things in common:
  1. They are made by random sites without particularly obvious connection to the subject matter. Why is Creditloan.com making an infographic about the hourly workweek?
  2. Those sites, when examined, either have virtually no content at all, or are for things like debt consolidation--industries with low reputation where brand recognition, if it exists at all, is probably mostly negative.
  3. The sources for the data, if they are provided at all, tend to be in very small type at the bottom of the graphic, and instead of easy-to-type names of reports, they provide hard-to-type URLs which basically defeat all but the most determined checkers.
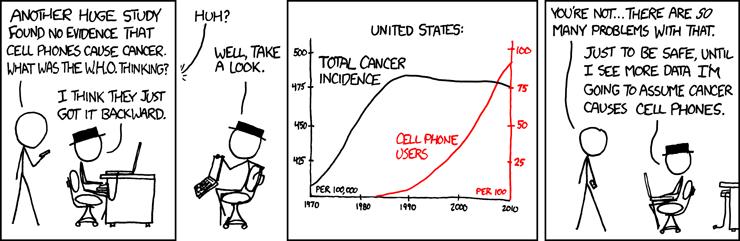
  4. The infographics tend to suggest that SOMETHING TERRIBLE IS HAPPENING IN THE US RIGHT NOW!!! the better to trigger your panic button and get you to spread the bad news BEFORE IT'S TOO LATE!
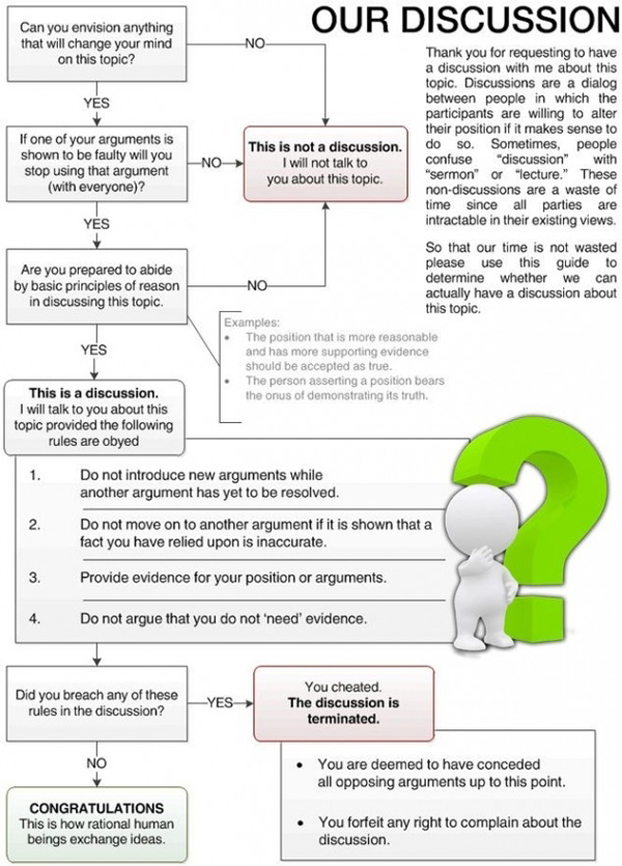
If that's too many words for you though, she also includes this graphic:


So while the infographic can be quite useful when tamed and sedated, if you meet one in the wild, be very very careful.  Do not approach directly, do not look it in they eye.  


Friends don't let friends use lousy infographics (I'm looking at you facebook).

Sunday, April 29, 2012

Weekend Moment of Zen 4-29-12

Since my mother still doesn't agree with any of my food desert postings, I thought of this comic.

Mom, I think we should consider that maybe obesity causes food deserts.  Think about I'm pretty sure I heard about obesity before I heard the phrase food desert.  I'm pretty sure that proves something.

Saturday, April 28, 2012

Circumventing the Middle Man

Well, my post on justifiable skepticism (Paranoia is just good sense if people actually are out to get you) certainly was the big winner for traffic/comments this week.  I was happy to see that...I had a lot of fun putting that graph together and thought the outcomes were pretty striking.  Thanks to Maggie's Farm for linking to it.

It was my post on food deserts however, that got me the most IRL comments.  Both my mother and my brother commented on it, and not terrifically positively.  In retrospect, I wasn't very clear about the points I was trying to make, though to be fair I had spent a lot of the day on an airplane.

My issue with food desert research, or any similar research, is that what we're really talking about is a proposed proximate cause to a larger issue: obesity.  In my experience, just having people tell you why they think something's happening, isn't good enough to prove that's the actual reason.  Thus my quibble with much of the theorizing about obesity problems....you have to make sure that what you're theorizing is the cause is actually the cause (or one of the causes) before you start dumping money in to it.  You cannot make the middle man the holy grail if you haven't established that it's really a cause.

Unfortunately, people love to jump on good ideas before truly establishing this link.

Example:  A few years ago, it was discovered that 22% of school children were eating vending machine food.  This school had an obesity problem, the food in the vending machines was unhealthy, so a push began to remove vending machines from schools.  Schools balked, as they make money from vending machines, but the well being of children came first.....until of course this study came out proving that reducing access to vending machines didn't actually effect obesity rates.   Oops.

It's really a simple logic exercise...proving that kids are (a) obese and (b) eating from vending machines does  not actually prove that getting rid of (b) will reduce (a).

That's why I liked the research in to the difference food deserts make in obesity.  It's a question that needs to be asked more often when trying to address a large issue:  are we sure that the issue we're trying to address will actually help the issue we were concerned about it the first place???


If you haven't established that it will, then be careful with how you proceed.  Addressing food deserts (or vending machines or whatever) is  a means to an end, and you shouldn't confuse it with the end itself...unless you have really good data backing you up.

Thursday, April 26, 2012

Trillion Dollar Debt Day

Bias alert:  I graduated college with a LOT of debt.  It was nearly ten years ago, but I was still far above the current average widely reported in the media.  In 3 years, I had paid off all but one loan that was locked at 2.3% interest.  I paid that off two years later due to the fact that Sallie Mae is an absurdly evil company and I was sick of dealing with them.  All in all, I was debt free 20 years earlier than projected and today have zero debt from either my bachelor's or master's degree.

Now, all that being said, I guess I can't feel too left out that I didn't get invited to the student protest that was Trillion Dollar Debt Day.  Apparently yesterday was the day that total student loan debt in this country hit $1,000,000,000,000.  Want to see it in real time?  Here you go: 


Anyway, student debt is a complicated issue with lots of statistics ripe for dissection.  Actually, the debt really isn't that complicated....it's there because college costs have gone up far more than average household income has, and more people are going for both grad and undergrad degrees.  What's complicated is how people interpret what to do with these statistics.  For example (from the clock website above):  "Student loan debt, on the other hand, as been growing steadily because need-based grants have not been keeping pace with increases in college costs." Not hard to see what that websites solution would be to this issue.

The 1 trillion number is impressive, but it is not often mentioned how heavily the increase in debt level correlates with how sharply the number of students have gone up.  According to the National Center for Education Statistics "enrollment in degree-granting postsecondary institutions increased by 9 percent between 1989 and 1999. Between 1999 and 2009, enrollment increased 38 percent, from 14.8 million to 20.4 million."  Nearly 6 million people extra people in 10 years, combined with rising costs and a recession...that will make that number shoot up in a hurry.

In the past 5 years, the average debt per graduating college student (bachelor's level) has only gone up by about $4000, unadjusted, or $2500 in adjusted dollars.

YearAverage DebtAverage Debt (2010 $)Median EarningsMedian Earnings (2010 $)Debt:Earnings (inflation-adjusted)
2006$21,100$22,822$45,221$48,9120.47
200721,90023,03246,80549,2240.47
200823,20023,49747,09447,6960.49
200924,00024,39447,51048,2890.51
201025,25025,25047,42247,4220.53
Sources: Project on Student Debt, U.S. Census American Community Surveys (1-year estimates, 2006-2010), Bureau of Labor Statistics CPI Inflation Calculator.

  You multiply even that amount over 20.4 million however, and the levels start reaching crisis proportion.  Additionally, these "average" numbers, while reported very exactly, are all self reported by the schools.  Also, out of the 2,300 schools they asked, 500 were tossed for identification reasons, and about 300 just didn't report anything.  This makes these numbers highly suspect.

Overall, I'm not saying there's not a crisis.  I work in health care, and it's totally ludicrous to me that while we're all scrambling to cut costs as fast as we can, higher education is not doing the same. I've also had a mortgage for nearly as long as I had my student loans, and I can tell you that my mortgage company has not once pulled any of the disgusting shenanigans that Sallie Mae pulled with my student loans.  I used to have to save my receipts because they, I kid you not, used to ADD small amounts of money to my balance at random.  I would then have to spend 45 minutes on the phone with them proving that this had happened.  I was always right, they would merely "apologize for the misunderstanding".

However, with this issue, as with so many others, watch the numbers when emotions run high.  People love to throw data at others in these moments, knowing it won't be questioned.  Business Insider, for example, claims that "For many of you, your degrees won't matter. One-third of you will land full-time jobs that don't require them."  They don't mention that's 33% of 500 people who just graduated.  Check back in 5 years, BI, then show me the numbers.

Wednesday, April 25, 2012

Begin with the end in mind

Most of what I do all day is in the loose category known as operations research.  This is an interesting sort of research that typically starts with a question, and then involves gathering qualitative and quantitative data until you get a hypothesis.  Adjustments are made until you get going in the right direction, which is normally related to either getting more of a good thing or less of a bad thing...or often both.

This is my favorite type of research for any field for a variety of reasons: it's practical, it helps people, it tends to cut through feelings and deals with facts, and it leaves room for people to be surprised.   

The downside is that the questions are often complex and the answers multi-dimensional.  That's why good research of this kind is so darn impressive.  I read a great article today about Jacqueline Campbell and her work to reduce domestic homicide.  She started with a complex problem, and worked both forward and backwards until she came up with something that worked.  Working backwards, she went deep in to the statistics to figure out which situations were the most likely to result in homicide, and then trained the front end responders how to reach out to those who were at the most risk.  While she will not claim credit, it is noted that  the state where she implemented this program (Maryland) has cut their domestic homicide rate in half.  

Domestic violence is an issue that can very easily get mired down in politics and emotion, so it's interesting to note that this is one of the few programs that is getting bipartisan support.  That's such a good outcome when somebody actually pragmatically addresses an issue rather than just catering to their own pet theories.

To note: starting research with a goal in mind is beneficial only when it's not a guise to push an agenda.  It's only good if you really don't know how to get there.   I feel this is research at it's best, research that actually helps a real world problem.  I have nothing against research that helps us see the world in new ways, but my practicality bias is probably why I did engineering and not theoretical physics.  It takes all types, I just wish more would focus on the "how do we get there" type questions.

Tuesday, April 24, 2012

The rise of the datasexual

Datasexual...apparently it's a thing.

Sometimes I worry that's what I might become...obsessed with my own personal data, quantifying myself until there's nothing left that can't be counted.  I already have an embarrassing number of spreadsheets in google docs dedicated to tracking all sorts of things in my life....7 I'm currently updating regularly.

Normally, my love for efficiency saves me though.  In healthcare, there's a pretty unending stream of data, so we've had to learn how to sort through to what's useful.  If you don't know how you'll use it immediately, or at least have a very large hunch, we don't collect it.

If efficiency doesn't work as a motivator, I figure that's a sign I need to get outside.  Good thing I have a dog to remind me to do that.

In case you're curious, on a sunny day like today, he'll walk for an average of 24.6 minutes, with a standard deviation of 3.3, highly dependent on whether or not we see the UPS guy go by.  He HATES the UPS guy.

Monday, April 23, 2012

Paranoia is just good sense if people really are out to get you

Yesterday I posted about retractions in scientific journals, and the assertion that they are going up.  I actually woke up this morning thinking about that study, and wishing I could see more data on how it's changed year to year (yes, I'm a complete nerd...but what do you ponder while brushing your teeth????).  Anyway, that brought to mind a post I did a few weeks ago, on how conservatives trust in the scientific community has gone steadily down.

It occurred to me that if you superimposed the retraction rate of various journals over the trust in the scientific community rates, it could actually be an interesting picture.   It turns out PubMed actually has a retraction rate by year available here.  For purposes of this graph I figured that would be a representative enough sample.

I couldn't find the raw numbers for the original public trust study, so these are eyeballed from the original graph in blue, with the exact numbers from the PubMed database in green.  

So it looks like a decreasing trust in the scientific community may actually be a rational thing*.  

It's entirely possible, by the way, that the increased scrutiny of the internet led to the higher retraction rate...but that would still have given people more reasons not to blindly trust.  As the title of this post suggests, skepticism isn't crazy if you actually should be skeptical.

Speaking of trust, I obviously had to manipulate the axes a bit to get this all to fit.  Still not sure I got it quite right, but if anyone wants to check my work, the raw data for the retraction rate is here and the data for the public trust study is here.  These links are included earlier as well, just wanted to be thorough.  

*Gringo requested that I run the correlation coefficients.  Conservatives r = -0.81 Liberals r = 0.52 Moderates r = 0.  I can't stand by these numbers since my data points were all estimates based on the original chart, but they should be about correct.

Sunday, April 22, 2012

Bad data vs False Data

We here at Bad Data Bad would like to note that when we pick studies to criticize, we operate under the assumption that what the studies actually published are accurate, and that most of the mistakes are made in the interpretation or the translation of those findings in to news.

This article from the New York Times last week reminds us that this may not always be a good assumption.

A few fabricated papers have managed to make news headlines over the past few years....the Korean researcher who said he'd cloned a stem cell....the UConn researcher who falsified data in a series of papers on the health benefits of red wine....and a Dutch social scientist who faked entire experiments to get his data.

This is where the scientific principle of replication is supposed to step in, and why it's always a decent idea to withhold judgement until somebody else can find the same thing the first study did.  Without that, it's nearly impossible to know if someone falsified their data, without people in their own lab blowing the whistle.

If you're curious about these retractions, the Retraction Watch blog is a pretty good source for papers that get yanked.

Friday, April 20, 2012

Food Deserts and Big City Living

The Assistant Village Idiot did a good post on a new report on the prevalence of "food deserts" and if this was the crisis it's been reported to be.

While I will point out that the study refuting the idea of food deserts uses self reported data for height, weight and eating habits (check out my previous post on this issue), I was glad to see someone take this issue on.  Food deserts reporting has always fascinated me, mostly because I lived in the middle of the Boston area (albeit in different locations) for about 9 years.   The food desert idea always sort of baffled me, and when I took a look at the USDAs food desert locator, I notice that the only part of Boston proper or the close suburbs that qualifies as a food desert is.....Logan Airport.

I currently live in a suburb that is near 2 food deserts, so checking those out was interesting as well.  One is actually a small peninsula, and I happen to know you have to drive by a grocery store to get on the main route out there.  The other is next to the docks.

For cities, this data gets complicated by the fact that many very small grocers sell all sorts of produce in small spaces that wouldn't make the list.  For rural areas, personal gardens are not counted.  I also liked that the article pointed out that some people researching this have done grocery stores/1000 people, a metric which make cities look bleak.  That's a classic case of needing to review why you actually want the data.  A busy grocery store is not a lack of a grocery store.  Additionally, I have never seen one of these surveys that added in farmer's markets or grocery store delivery services.  While not always the cheapest option, delivery services allowed me (when I was a broke college student) to buy in bulk and save money other ways.  They run about $7 ($5 when I was in college), when a train ride to and from the store was $4 round trip, and a taxi would have been at least $10 (not counting ghost taxis that exist almost exclusively in front of city grocery stores and help you with your groceries for around $5).

Overall, I'm sure access is an issue for some people, I just balk when people who don't live in the middle of cities on a limited budget like I did try to tell me what it's like.  I DO think that before we flip out about an issue, doing research as to how much access really affects obesity is key.  The number of regulations and reforms that get pushed without any data proving their relevance staggers me, and I'm glad to see someone questioning the wisdom in this case.

Fun Quotes for Friday

Intuition becomes increasingly valuable in the new information society precisely because there is so much data.
John Naisbitt

It is a capital mistake to theorize before one has data.
Arthur Conan Doyle

Thursday, April 19, 2012

I do not think it means what you think it means....

Oh teamwork.

I sat in a fascinating talk yesterday about some pretty interesting team failures.  One in particular stuck out to me: two teams, working on the east and west coast, funded by a huge grant from the NSF.  One team was tasked with building a database, the other was going to populate it with all of the data.  A year's worth of work later, it was discovered that the two teams had never clarified what they meant by several words (including the word data) and that the whole thing was completely useless.  

Oops.  

Now, there are several lessons in that story, but one of them is the importance of knowing what certain words mean to the people who are saying them.  This can be a big issue in reading research and interpreting data, especially around popular public health type issues.  There are many issues...."rape" "excessive drinking" "binge eating" and "substance abuse" to name a few....that people tend to believe there is one hard and fast definition for.  When reading studies on these things, always verify that the authors definition matches your own.  In looking for good examples of this, I found this report on some drinking statistics that were being floated around a few years ago.  

A new study from Columbia University's National Center on Addiction and Substance Abuse (CASA) claims that adults who drink excessively and youths who drink illegally account for over half of the alcohol consumed in the United States, and that the alcoholic beverage industry makes too much money from these groups to ever voluntarily address the problem.
 The article goes on to point out that if you look at the data, "excessive drinking" was defined as more than two servings of alcohol in one day, with no respect for height, weight, or frequency.  I somehow doubt this is the picture most people got when they read "adults who drink excessively".

This comes up a lot in studies that have psychiatric diagnoses attached as well.  I have a friend who works with eating disorders who gets annoyed to no end that you can't technically call someone anorexic until they're 15% under a healthy body weight or have had their period stop, even if they stop eating for weeks.  Not many people know that up until this year, the FBI defined rape as something that could only happen to women.

Things to watch out for.

Tuesday, April 17, 2012

Boston vs Chicago

This week, Bad Data Bad is coming to live from downtown Chicago, just a few feet away from the Magnificent Mile!

I'm at the Science of Team Science conference, and so far it's going pretty well.  I got a chance to present and discuss some of my research with people last night, and it's fun having people recognize more of the psych aspect of what I've been doing.  Your normal bone marrow transplant crowd really doesn't care about that part of anything, so it was nice to have people recognize the theories behind what I was doing.  They're posting the abstracts online at some point, I'll link to them when I figure that out.

Anyway, on my flight out here the data geek in me realized that a Boston/Chicago comparison would be a great input for the Google Ngram Viewer.  If you haven't played with this yet, it's fun.  Basically it tracks how many times the words you put in were mentioned in books over the last 200 years.  They uploaded a massive number of books to get the data, so the results are kind of fun.  Here's Boston vs. Chicago:

For reference, Chicago wasn't founded until 1837.  I tried running it starting at Boston's founding in 1630, but that made a weird spike that made the rest of the graph look silly.  My guess is that's a function of fewer books from that era loaded in to the database, since the y-axis is percentage.

For more about the project behind google ngrams, here's my good friend TED to explain:

Sunday, April 15, 2012

Weekend moment of zen 4-15-12

The moment in my childhood when I realized data reliant on self reporting was probably suspect:

I miss those two, they taught me so much. 

Saturday, April 14, 2012

Why career advice on the Internet can be total crap

I like nurses, though I've never wanted to be one.  My mother's a nurse, my sister will be in a year or so.  Most of my best projects have been done in conjunction with nursing departments.  Due to my proximity to lots and lots of nurses, I tend to hear a lot about the ups and downs of the profession.

Given that, this article annoyed the heck out of me.

The headline reads "How To Land A $60K Health Care Job With A Two-Year Degree", and being curious about the salaries of those around me, I took a peak.  I was stunned to see that the supposed "$60K job with 2 years of education" was nursing.  As proof, they offered the average annual salary for RN's as $67,000 (backed up by the BLS here.  (The BLS actually used the median, which is slightly lower at $64,000).  They went on to mention that nurses in Massachusetts make an average of $84,000 a year.

Now that all sounds awesome, but here's what's deceptive:  RN is not a degree.  RN is a license.  Neither the Bureau of Labor Statistics nor this article differentiate between the salaries of those who get an RN after getting an associate's degree, and those who get it after getting a bachelor's degree.  It turns out there's a lot of debate over how much of a difference this makes, but I can definitely speak to that Massachusetts salary number.  I work for one of the institutions that's notorious for paying nurses extremely well.  They do not hire nurses who don't have a BSN.  For most of the major Boston teaching hospitals, this is an increasing trend.  The Institute of Medicine is calling for 80% of nurses to be BSN educated by 2020, and many hospitals are responding accordingly.  Most management jobs are off limits to associate's level nurses.

I'll leave it to the nursing associations to debate whether all this is necessary or not, but I will bring up that taking an average of two different degrees with two different sets of job prospects and then not mentioning that it may be apples and oranges.  Additionally, even when nurses and nurse managers make the same amount, it's often because one is overtime eligible (and works nights and evenings) and one doesn't.  So overall, deceptive headline, designed to make people click on it.

Of course since I did click on it, I guess that worked.

Friday, April 13, 2012

Friday links for fun - 4.13.12

This will be completely lost on you if you're not a Hunger Games fan, but the stats work/extrapolation is pretty damn impressive.

Professionally, I found this interesting....I can only get you the numbers, ma'am, I can't make you use them wisely.

I haven't talked much about small sample sizes, but this blog does.

These guys are my new heroes.  They noticed a statistical error that kept popping up in neuro research, and then went back and figured out how often people were getting it wrong....half of the studies that could have got it wrong did.  It's a stat geeky read, but hears the story.

Thursday, April 12, 2012

Age Bias and Polling Methods

A few years ago, in one of my research methods classes in grad school, a professor I had asked us to raise our hand if we had a cell phone.  

Everyone raised their hands.  

Then he asked people to keep their hands up if they had a land line as well.  

Many hands went down.  

For those left, he asked how many answered it regularly or had caller ID and screened calls.  

Pretty much everyone.

This of course then led in to a discussion of political polling and how many of us had ever considered who was actually answering these questions.  It was an interesting discussion, as pretty much the entire class admitted they would have self excluded.  The Pew Research center suggests this was not an anomaly, and that this is actually a problem that's becoming more acute in political polling.  

While many large national polling organizations have started calling cell phones as well, on the state level this is not often corrected for.  This can, and has, resulted in some inaccurate polls, as the sample of people home, with a landline, willing to answer a pollsters call, does not always reflect the general population.  Actually, I think there's good reason to question the representativeness of a sample willing to answer their phone for an unknown number, but that could be disputed (those interested enough to pick up the phone also might be more likely to actually go vote).  

Anyway, none of this is new.  What is new this (presidential) election cycle is that news organizations are now starting to put up stats on Twitter and Facebook status updates.  I decided to take a look and see exactly how skewed these stats are, and found that Twitter is most popular in the 18-29 demographic.  Of course, this is the least likely demographic to actually vote.  Interestingly, the poll on Twitter usage did not include people under 18, but these are not excluded when they are compiling trends.  

So two different ways of tracking elections, two different sets of flaws.  Pick your poison.

Plans for next weekend....

I'm headed to a conference in Chicago next week, and I don't know that I'll be back in time for this, but it looks awesome.  

Wednesday, April 11, 2012

There's bad data, and then there's data that's just plain mean....

I've worked at teaching hospitals for pretty much my whole post-college career, so I generally heave a bit of a sigh when I hear the initials "IRB".  IRB's (Institutional Review Board) are set up to protect patients and approve of research, but they also have power to reject proposed studies and cause lots of paperwork.  Sometimes though, you need a good reminder of why they were invented.

Apparently, some scientists in the 1940's tried to develop a pain scale based on burning people and rating the pain.  Then, to make sure they had a good control, they burned pregnant women while in between contractions.

While it actually wasn't a half bad way of figuring out what their numerical scale should look like, that is just WRONG.  As a pregnant women, I can pretty confidently say that anyone coming at me with a flat iron during labor will be kicked.  Hard.

Unethical gathering of data is not only not worth it, but also frequently wasted.  In the study mentioned above, the data proved useless, as pain is too subjective to be really quantified.  After this fiasco, it wouldn't be until 2010 that someone came up with a really workable pain scale.

Tuesday, April 10, 2012

You can't misquote a misquote

Yesterday I talked about sensational statistics and to always verify that there's no missing adjectives that would change the statistic.  It was thus a bit serendipitous that today I happened to hear a debate about a misquoted statistic, and whether the quote or the misquote was more accurate.  It was on a podcast I listen to, and it was about a month old (sometimes I don't keep up well).

It was happening around the time the contraception debate was at it's most furious (see what I did there?  It was a federally mandated coverage of contraception debate, to give you all the adjectives).  Anyway, at the time the statistic about the prevalence of birth control usage among Catholic women was getting tossed around quite a bit.  The statistic, in it's most detailed form, is this:  98% of self-identified Catholic women of child bearing age who are sexually active have used a contraceptive method other than natural family planning at some point in their lives.

Now, this stat rarely got quoted in it's entirety.  First, I always think designating that the religions is self identified is important.  The women answering this survey didn't have to clarify if they thought they were good Catholics, just Catholic.  Second, the "sexually active" got glossed over as well, despite the fact that it probably cuts down the numbers at least a bit (for young adult Catholics, to approximately 89% of respondents).  Third, "at some point".  The study's authors have justified this qualifier by arguing that if a woman is on birth control for years, then decides to start trying to have children and goes off of it, she would have been excluded.  Critics have argued that this strategy was designed to include women who may have tried it, decided it was wrong, and stopped.  Both have a point.

That being said, I most often heard this being quoted as "98% of Catholic women use birth control" or sometimes even "98% of Catholics use birth control".  

It was that last phrase that got the debate going on the show I was listening to.  Person 1 argued that it annoyed him that people kept dropping the "women" part of the quote.  Person 2 shot back that it actually drove him nuts that people felt the need to add it.  He argued that for every straight female using contraception, there was by definition a straight man using it.  Unless one presumed a statistically significant number of women were misleading their partners, 98% of Catholic men were also using birth control (of course, even if they were being misled, they were actually still using it...just not knowingly).  Since according to Catholic doctrine the contraception mandate is for both genders, both parties are therefore guilty.

I liked the debate, and would be totally fascinated to hear the numbers on men who have used (or had a partner who used) contraception.  I am curious if a significant number don't know, or would claim not to know.  I still think that clarifying "women" in the quote is fine, as it's who the study was actually done on.  In my mind extrapolation should always be classified as extrapolation, not an actual finding.

Also of note, this was an in-person survey.  That's always useful to realize that every answer given in a survey like this had to verbalize their answers to another person....important when the topic is anything highly subject to social pressures.  For a further breakdown of issues with that study, see here.

Monday, April 9, 2012

Beware the Adjective

My tax return showed up in my bank account this weekend, which is always nice (even if it was my money to begin with).  It brought to mind a few months back when people were big on the "50% of American households don't pay any federal income tax" statistic.

Now, that was an interesting statistic, and one that no doubt caused a lot of emotion.  I mean, heck, this is my percent breakdown of taxes paid for 2011 (excluding sales-linked taxes...that retrospective would have taken all week):

Edit: My labels got a little hinky, so assume federal tax = federal income tax and state tax = state income tax.  So yes, life would have been a great deal cheaper if I could have avoided federal income tax.

Anyway, I was thinking about this when I stumbled across this chart:

Along with this post explaining that many of the households not paying taxes were actually older workers.  Interesting, but economic data is so easily manipulated it doesn't normally catch my attention (example: no where on this graph does it indicate how large each population slice is...I'm sure there are far fewer people represented at the end of the graph than at the middle).

Anyway, what this jogged my memory about was how this statistic got quoted by many at the time.  Rick Warren was one of the more notable examples, but many people made the mistake of stating "half of all Americans pay no taxes".  The "Federal Income" part of that phrase makes a huge difference.

I'm certainly not saying that everyone who misquotes a stat does so intentionally.  Many times it's innocent, and thus it's something to keep in mind when you hear a crazy statistic from anything but the source.  Politicians and other public speakers do just flat out miss words sometimes.  There are some pretty horrifying stats out there that become much more reasonable when the correct modifiers are put back in their place.  

Sunday, April 8, 2012

Easter Infographic

Most infographic's are not terribly accurate or useful.  However, it's Easter, and this is pretty:

Friday, April 6, 2012

Friday links for fun - 4.6.12

Two fun articles taking on bad data:

This one covers everything I will probably ever say in this blog, but with less pizzazz.

This one is trying to stop bad data before it starts.  Don't try to make things in to a scientific experiment if you have to fudge around things to do it.  Just call it a model.  I like that.

Thursday, April 5, 2012

That's some bad data, bad to the bone

Not the most useful data on the planet, but fun never the less....especially if you are a data geek married to a metal head.  Not that I'd know anything about that.

Heavy metal bands per capita for every country except Bhutan:


In case you're curious, here's an article explaining more, including the actual numbers used.

Thanks to some research carried out by me and my wonderful husband, we discovered that Bhutan now has 1 metal band that was formed in 2008.  Their name is Metal Visage.  Here's a review.  Oh, and if you're super curious, here's a video.  I have no idea if they're good or offensive or what, as my dog started barking as soon as I hit play, but my husband assures me they are better than Ugra Karma (one of Nepal's 12 metal bands)

Anyway, not much to criticize here, as sadly this is probably more accurate than most of the studies I write about.  I did find it amusing that I saw a comment about this where someone was greatly disturbed that the CIA world factbook was cited as a source.  I considered politely explaining to them that that was probably where the population numbers came from, not the metal band numbers, but I decided not to.  Read ALL the sources folks, thank you.

Wednesday, April 4, 2012

Opinions, everybody's got one

I was listening to a management podcast recently where a man named John Blackwell was being interviewed.  He was talking about how he was constantly reading things about how the whole workplace was changing, but he was getting curious as to why he felt like the companies he worked with weren't reflecting this.  When he tried to investigate, he found out that the ongoing surveys commonly used in British management journals (can't find a link) were being done on the "up and coming business leaders".  When he looked in to what that meant, he realized it was people who were second year MBA students.

The problem with this, of course, was that this was asking people not in the workforce what the workforce was going to look like 10 years from now.  They found, not surprisingly, that young people in grad school tend to be very optimistic about things like "working from home" or "flex time" when they're in school, but when they got in to business, they towed toed the line.  Thus, every survey done was essentially useless.  

This all reminded me of a conversation I got in to several years ago when I was working the overnight shift.  Someone had brought in a magazine (People or Vogue or something like that) and they had a ranking of the 100 most beautiful women in Hollywood.  Drew Barrymore was number one that year, and one of my (young, male) coworkers was actively scoffing at that.  "She's unattractive," he stated definitively.  "All the guys I know think so too."

Now, I was feeling a little feisty feminist that night, so I thought about how to challenge him on that.  Leaving aside that "Hollywood unattractive" would still turn heads in any average crowd (and be more attractive than any girl he'd dated), something about his comment irked my data side.  "So maybe the voting was done by women," I replied.  

He was floored.

I noted that it was not a men's magazine that ran the story, so really women's opinions of other women's attractiveness would actually be more relevant to this list.  Furthermore, as most of the leading women in Hollywood make their money on romantic comedies, professionally women's opinions of their attractiveness (which presumably included a certain likeability factor) would actually matter more than men's.

I was fascinated that this clearly disturbed him.  It had clearly never occurred to him that straight men may not be the target audience for female attractiveness, or even that the relevance of his opinion might get questions.  He wasn't trying to be a jerk, he was legitimately confused at the whole idea.

A long intro, but the bigger point is important.  In any opinion survey or research, it's important to figure out whose opinion is most relevant to what you're trying to get at and why.  When it comes to law and public policy questions, I think every voter is relevant.  When it comes to workplace trends?  You may need to narrow your sample.

Sampling bias is a huge problem in many contexts, but my primary one for today's post is when the survey was not conducted with the end in mind.  For any sample, you have to figure out how much your subject's opinions actually matter given what you're trying to find out.  In social conversation it may be interesting to find out what a particular person thinks of a topic, but for good data, show me why I care.

Tuesday, April 3, 2012

Stand Back! I'm going to try SCIENCE!

Today I discovered that my favorite webcomic (xkcd.com) actually has a special comic up if you check it from my employer's server.  Turns out the artist's wife is a patient, doing well, and he wanted to show some love.  This post is thus titled for this shirt, which would make an awesome Christmas present for me, even in April.

Anyway, this weekend I saw this story with the headline "Study: Conservatives' Trust In Science At Record Low".

My first thought on seeing this was that the word "science" is a loaded word.  I mean, I'm as much a science geek as anyone.  Math's my favorite, but science will always be a close second.  But do I trust science? I'm not sure.  Something really bothered me about that question, but I couldn't quite put my finger on it until I read this post on the study from First Things today.  

My love of science makes me a skeptic.  I makes me question relentlessly and then continuously revisit to figure what got left out.  I don't trust science because not trusting your assumptions is science done right.  If we could all trust our assumptions, what would we need science for?  This is the problem with vague questions and loaded words.  Much like the discussion in the comments section of this post where several commenters weighed in on the word "delegate" in relation to household tasks, it's clear that people will interpret the phrase "trust science" in many different ways.

Some might say it means the scientific method, scientists, science as a career, science's role in the world, or something else not springing to mind.  Given the vagueness of the question though, I would have a hard time actually calling anyone's interpretation wrong.  Mine is based on my own bias, but I would wager everyone's is.  So isn't this survey more about how we're defining a phrase than about anything else?

I thought my annoyance was going to end there, I really did.

Then I looked at the graph with the story, and had no choice but to get annoyed all over again.

That's what I get for just reading headlines.

So over the course of this survey, moderates have consistently trusted science less than conservatives for all but four data points?  Why didn't this get mentioned?  I found the original study and took a quick look for the breakdown: 34% self identified as conservative, 39% as moderate, and 27% as liberal.  So 73% of the population has shown a significant drop off in "trust of science" and yet they're somehow portrayed as the outliers?  Science and technology have changed almost unimaginably since 1974, and yet liberal's opinions about all that haven't changed*?  Does that strike anyone else as the more salient feature here?

*Technically this may not be true.  I don't know what the self identified proportions were in 1974, so it could be a self-identification shift.  Still.  This might be that media bias everyone's always talking about.

Book Recommendation - How to Lie With Statistics

If one has free reading time or just really likes lists (and boy do I love a good list!) the Personal MBA reading list is pretty darn cool.  It claims to give you knowledge equivalent to an MBA in 99 books, without any of the crippling debt.  I'm about 10 books in, and there's some really great stuff on data, statistics, analysis and presentation.

One of the classics of course is How to Lie With Statistics.  It's a great book, easy reading, though the examples are outdated to the point of near distraction (salaries list at $8000/year, that sort of thing).  Still, clear and concise, and shows you that bad data has been around for quite some time.

One of my favorite moments is when he goes after Joseph Stalin for his bad data....in retrospect that kind of feels like saying Hitler was a bad dresser.  Still, pretty interesting to see where the misinformation starts.  This book should be required reading for everyone.

Sunday, April 1, 2012

Arguments and Discussions...learning the rules

I was struck by something that commenter Erin mentioned in response to my post about data that I hate.   She ended her comments with this:

I teach this stuff to my AP students...I love trying to get them to understand how to break apart political rhetoric and other arguments around them. I figure even if we disagree wildly in politics or social issues, at least I'll have an intelligent opponent to argue with someday. 
I like that, because I fully endorse that approach to life.  That's part of why I wanted to do a blog like this.  Quite some time ago, the Assistant Village Idiot put up a post I liked very much (and can't find now...circa 2007?) about how far too many people treated their political opinions as though they were defense lawyers....never giving an inch, never admitting that anything they had said or cited could be wrong or skewed.  This makes lots of people defend really stupid things.

In my office, this flowchart hangs just to the right of my computer:

I often have fantasies of taking it down during debates and serenely handing it to the other person whilst telling them to try again.  Sadly, I have never done this.  The fantasy keeps me going some days though, doubly so in political debates.

Though I'm probably preaching to the choir hear, I feel the need to state for the record:  Just because something you cited is wrong does not mean you are wrong.  You can keep your belief while also admitting that something that agrees with you is a load of crap.  That actually makes you a better person, not a worse one.  This is not an April fools joke, people actually can operate like this.