I have a sleeping baby in my lap, so you'll forgive me if I have a one track mind.
Yesterday we met with a nurse who let us know that in Sweden, they have now set minimums for skin to skin contact between mom and babies during hospital stays. If you don't do the minimum, you pay the hospital bill. This morning, in my first perusal around the internet in a few days, I see that Mayor Bloomberg is trying to find ways of encouraging new mother's to breastfeed.
A note on research regarding babies and various practices in infancy: Babies are a lot of work. I realize I'm preaching to the choir on this, as many of my readers have successfully raised quite a few children, but it's true. Many of the practices that show lots of benefits for babies (skin to skin contact, breastfeeding, etc) take even more time than the alternatives. While I believe these things are good for babies on their own, all data collected on these practices will be complicated by the fact that parents who engage in them tend to have more time, resources, and support than those who don't. Pushing these practices on those who are already particularly stressed may not have as profound an outcome as it did in the study, as the groups went from self selecting to random.
Something to think about for the policy makers.
Sorry, I've been reading over a lot of hospital literature and getting mildly annoyed. I think that means the pain medication has worn off. Nurse!
Showing posts with label Sampling bias. Show all posts
Showing posts with label Sampling bias. Show all posts
Wednesday, August 1, 2012

Saturday, July 28, 2012
Too hot to hire?
....or why psych undergrads would make lousy hiring managers.
I saw this study pop up on Instapundit, and while the number of "that happens to me all the time" jokes are infinite, I'm pretty sad this study got mentioned at all. Here's the Router's recap:
None.
This study didn't study women or men actually applying for jobs. They studied what happens when you give a bunch of psych undergrads a huge stack of pictures, a list of job titles and say "sort these pictures in to groups of who you think would be most qualified for a job based solely on the pictures". Seriously, that's what they did. Read the full study here.
It turns out that when you ask 65 undergrads (mostly women) to rank a whole bunch (204) of photos of people using no criteria other than what they look like, people might judge other people based on what they look like. There was some lovely statistical analysis in here, but at no point did they attempt to prove that asking a 20 year old (who presumably had no first hand knowledge about any of the fields other than psych) to sort a picture reflected at all what goes on in hiring offices.
In fact, this is what the "practical implications" section of the paper said:
While I'm sure that physical appearance does make a difference in hiring practices, I would have loved to see a little more time dedicated mimicking the real world before announcing that women were facing discrimination in certain professions. To allow these results to be propagated as proof of what goes on at legitimate companies is a bit of a stretch, and points the finger at people who never even got asked what they would do.
I saw this study pop up on Instapundit, and while the number of "that happens to me all the time" jokes are infinite, I'm pretty sad this study got mentioned at all. Here's the Router's recap:
Attractive women faced discrimination when they applied for jobs where appearance was not seen as important. These positions included job titles like manager of research and development, director of finance, mechanical engineer and construction supervisor.Oh the sad sad existence of beautiful women. To work so hard on your career and then get denied a job because you're too attractive. Now, out of curiosity, exactly how many women got rejected from these jobs for this study?
None.
This study didn't study women or men actually applying for jobs. They studied what happens when you give a bunch of psych undergrads a huge stack of pictures, a list of job titles and say "sort these pictures in to groups of who you think would be most qualified for a job based solely on the pictures". Seriously, that's what they did. Read the full study here.
It turns out that when you ask 65 undergrads (mostly women) to rank a whole bunch (204) of photos of people using no criteria other than what they look like, people might judge other people based on what they look like. There was some lovely statistical analysis in here, but at no point did they attempt to prove that asking a 20 year old (who presumably had no first hand knowledge about any of the fields other than psych) to sort a picture reflected at all what goes on in hiring offices.
In fact, this is what the "practical implications" section of the paper said:
Although the findings reported here demonstrate the “what is beautiful is good” and “beauty is beastly” effects, it is important to address the likelihood of such stereotypes influencing actual employment decisions. For example, in situations where there is a high cost of making a mistake, as would be the case for a hiring decision, one would expect the decision maker to rely more on individuating information, rather than on stereotypes about physical appearance. However, it is important to note that the bias for the physically attractive, unlike other stereotypes, seems to impact impression formation in a broader range of circumstances. Recent meta-analyses suggest that the what is beautiful is good effect is pervasive, even when the perceiver has additional information about the target (Hosoda et al., 2003; Langlois et al., 2000). Attractiveness may influence decision making at a subconscious level, where exposure to an attractive individual elicits positive feelings in the decision maker, causing him or her to judge the target more favorably (Eagly et al., 1991). Moreover, in situations where a decision maker is under a high cognitive load or under time pressure, he or she may be more likely to rely on stereotypes (Fiske & Taylor, 1991; Pendry & Macrae, 1994).So there is some proof that people favor attractive people no matter what, but no similar proof that they might discriminate against an attractive person if they had real world information. Which leads me to get a little weirded out by quotes like this from the researcher (in interviews, not the article):
"In every other kind of job, attractive women were preferred," said Johnson, who chided those who let stereotypes affect hiring decisions.Putting aside the fact that equality in this case appears to mean that everyone should prefer attractive people....what hiring managers was she chiding? The ones she never studied? Since the largest bias against attractive women was found when the mostly female undergrads were asked about who was qualified for male dominated fields....does that say more about what men think about women in non traditional fields, or what women think about women in non traditional fields?
While I'm sure that physical appearance does make a difference in hiring practices, I would have loved to see a little more time dedicated mimicking the real world before announcing that women were facing discrimination in certain professions. To allow these results to be propagated as proof of what goes on at legitimate companies is a bit of a stretch, and points the finger at people who never even got asked what they would do.
Thursday, July 19, 2012
What is STEM anyway?
I've been trying to work on a post about some further research on women in STEM fields, and I keep getting bogged down in definitions. I am currently headed down the rabbit hole of what a "STEM job" actually is.
I found out some interesting things. According to this report, my job doesn't count as a STEM job, despite the fact that I work with nothing but math and science (alright, and some psych). It's not the psych part that excludes me however, it's actually that I work in healthcare. Healthcare, apparently is excluded completely.
So if I were performing my same job, with the same qualifications, in a different field, I'd have a STEM job. Since I report in to a hospital however, I don't have one.
Your doctor does not have a STEM job. Neither does your pharmacist, dentist, nurse, or anyone who teaches anything on any level. Apparently if you run stats for the Red Sox, you're in a STEM job, but do the same thing for sick people, and it doesn't count.
Fascinating.
I found out some interesting things. According to this report, my job doesn't count as a STEM job, despite the fact that I work with nothing but math and science (alright, and some psych). It's not the psych part that excludes me however, it's actually that I work in healthcare. Healthcare, apparently is excluded completely.
So if I were performing my same job, with the same qualifications, in a different field, I'd have a STEM job. Since I report in to a hospital however, I don't have one.
Your doctor does not have a STEM job. Neither does your pharmacist, dentist, nurse, or anyone who teaches anything on any level. Apparently if you run stats for the Red Sox, you're in a STEM job, but do the same thing for sick people, and it doesn't count.
Fascinating.
Tuesday, July 10, 2012
19 women don't like sports
Normally this is the sort of thing Joseph's blog specializes in, but I couldn't let this one slide.
I've spent all of last week and this week listening to construction workers traipsing around my basement, working diligently to finish it so we can finally have the sports room my husband's impressive memorabilia collection deserves. Thus, it distressed me a bit to see the headline that married women only watch sports for the sake of their husbands. Is my interest in the sports room one big lie? Has my Red Sox fandom all been a fraud? Should I toss out all my vintage basketball cards from the 80s? And football.....okay, I actually didn't like it all that much until I got married. I'll give you that one. Two out of three ain't bad.
Anyway, I pretty amused when Jezebel and other's quickly pointed out that the sample size for this study was 19. 19 women, all from around the University of Tennessee. In case you're curious, The Bleacher Report ranked Knoxville the 44th best sports town in the USA. Maybe my perception is skewed because Boston's #2, but I'm not sure that's an overly representative sample from an overly representative town.
Get some good Southie girls together and ask them what they think, I bet you'll get a wicked different picture.
I've spent all of last week and this week listening to construction workers traipsing around my basement, working diligently to finish it so we can finally have the sports room my husband's impressive memorabilia collection deserves. Thus, it distressed me a bit to see the headline that married women only watch sports for the sake of their husbands. Is my interest in the sports room one big lie? Has my Red Sox fandom all been a fraud? Should I toss out all my vintage basketball cards from the 80s? And football.....okay, I actually didn't like it all that much until I got married. I'll give you that one. Two out of three ain't bad.
Anyway, I pretty amused when Jezebel and other's quickly pointed out that the sample size for this study was 19. 19 women, all from around the University of Tennessee. In case you're curious, The Bleacher Report ranked Knoxville the 44th best sports town in the USA. Maybe my perception is skewed because Boston's #2, but I'm not sure that's an overly representative sample from an overly representative town.
Get some good Southie girls together and ask them what they think, I bet you'll get a wicked different picture.
Thursday, June 14, 2012
It's all (culturally) relative
Last week I put up a post regarding a study on sexism levels in men whose wives stay at home. I argued that due to the diversity of that group of men, and the variety of reasons a woman might stay home, this study was essentially meaningless.
Another issue came up in the comments section that I wanted to touch on: cultural relevance of data.
Most studies that get press here in the US are from the US, performed on American subjects. This is sketchy business.
In the study about stay at home moms, mothers who worked part time were lumped in with the stay at home mothers. Interestingly, in the Netherlands, this would actually be 90% of the women. Does that mean that nearly every Dutch man married to a woman is more likely to be sexist? Or does it mean that part time work has different value in different cultures?
I took a look around for some other examples, and found that in China, many women see working as part of a new found freedom. At a conference I attended a few months ago, I talked to a man from Shanghai who mentioned that his wife went back to work because she couldn't have handled trying to fight off the two grandmother's, both of whom wanted to watch the child. Due to the one child policy, this was the only chance they would get to have a grandbaby. In many ways, it was actually the hierarchical/patriarchal culture there that pushed his wife to go back to work, as opposed to having her stay home.
As the world continues to flatten out, and as America continues to welcome new immigrants, we must be conscious of who studies are actually looking at and how generalizable the results are. In the sexism study, even the authors admitted their findings were meant to be a commentary on the US only....but it should raise some questions that they seemed to be chasing after a structure that doesn't exist in some very liberal countries.
Something to consider, depending on the goal of the study.
Another issue came up in the comments section that I wanted to touch on: cultural relevance of data.
Most studies that get press here in the US are from the US, performed on American subjects. This is sketchy business.
In the study about stay at home moms, mothers who worked part time were lumped in with the stay at home mothers. Interestingly, in the Netherlands, this would actually be 90% of the women. Does that mean that nearly every Dutch man married to a woman is more likely to be sexist? Or does it mean that part time work has different value in different cultures?
I took a look around for some other examples, and found that in China, many women see working as part of a new found freedom. At a conference I attended a few months ago, I talked to a man from Shanghai who mentioned that his wife went back to work because she couldn't have handled trying to fight off the two grandmother's, both of whom wanted to watch the child. Due to the one child policy, this was the only chance they would get to have a grandbaby. In many ways, it was actually the hierarchical/patriarchal culture there that pushed his wife to go back to work, as opposed to having her stay home.
As the world continues to flatten out, and as America continues to welcome new immigrants, we must be conscious of who studies are actually looking at and how generalizable the results are. In the sexism study, even the authors admitted their findings were meant to be a commentary on the US only....but it should raise some questions that they seemed to be chasing after a structure that doesn't exist in some very liberal countries.
Something to consider, depending on the goal of the study.
Thursday, June 7, 2012
Quote of the week and more recall coverage
Statistics are like bikinis. What they reveal is suggestive, but what they conceal is vital. ~Aaron Levenstein
I've been reading more of the Scott Walker recall election coverage, and was struck by the frequent references to Walker being "the first governor to survive a recall election". Of course this made me curious how many governor's had been recalled. I remembered the California governor a few years back, so I had been imagining it would be at least a dozen or so.
Nope.
It's two. Lynn Frazier from North Dakota in 1921, and Gray Davis from California in 2003.
I had to laugh at my own sampling bias. My assumptions were pretty understandable....I've been of voting age since 1999, and in that time this has happened twice. Therefore it was reasonable to assume this happened at least occasionally. I figured about once every 10 years, which would be 23 or 24 in American history. I was pretty sure not every state had a recall option, so I halved it. 12 felt good.
This is the problem when data leaves out key points....it relies on our own assumptions to fill in the details. Engineers are normally trained to get explicit with their assumptions when estimating, as evidenced by the famous Fermi problem. However, even the most carefully thought through assumptions are still guesses.
That's why it's important to remember the quote above: what you're shown is important, but it's not half as interesting as what's hidden.
Nope.
It's two. Lynn Frazier from North Dakota in 1921, and Gray Davis from California in 2003.
I had to laugh at my own sampling bias. My assumptions were pretty understandable....I've been of voting age since 1999, and in that time this has happened twice. Therefore it was reasonable to assume this happened at least occasionally. I figured about once every 10 years, which would be 23 or 24 in American history. I was pretty sure not every state had a recall option, so I halved it. 12 felt good.
This is the problem when data leaves out key points....it relies on our own assumptions to fill in the details. Engineers are normally trained to get explicit with their assumptions when estimating, as evidenced by the famous Fermi problem. However, even the most carefully thought through assumptions are still guesses.
That's why it's important to remember the quote above: what you're shown is important, but it's not half as interesting as what's hidden.
Wednesday, May 23, 2012
The (ACS) Devil and Daniel Webster
As a New Hampshire native, I am prone to liking people named Daniel Webster.
It is thus with some interest that I realized that the Florida Congressman who is sponsoring the bill to eliminate the American Community Survey happens to share a name with the famous NH statesman. I have been following this situation since I read about it on the pretty cool Civil Statistician blog, run by a guy who runs stats for the census bureau.
Clearly there's some interesting debate going on here about data, analysis, role of the government, and the classic "good of the community vs personal liberty" debate.
I'm going to skip over most of that.
So why then, do I bring up Daniel Webster?
Well, I was intrigued by this comment from him , as reported in the NYT article on the ACS:
I was curious, first of all, what the background was of someone making that claim. I took a look at his website, and was pleased to discover that Rep. Webster is an engineer. It's always interesting to see one of my own take something like this on (especially since Congress only has 6 of his kind!).
That being said, is a random survey unscientific?
Well, maybe.
In grad school, we actually had to take a whole class on surveys/testing/evaluations, and the number one principal for polling methods is that there is no one size fits all. The most scientifically accurate way to survey a group is based on the group you're trying to capture. All survey methods have pitfalls. One very interesting example our professor gave us was the students who tried to capture a sample of their college by surveying the first 100 students to walk by them in the campus center. What they hadn't realized was that a freshman seminar was just letting out, so their "random" survey turned out to be 85% freshman. So over all, it's probably worse when your polling methodology isn't random than when it is.
There's all kinds of polling methods that have been created to account for these issues:
Now, NYT analysis aside, I wonder if this is really what Webster was questioning. The other meaning one could take from his statement is that he was challenging the lack of scientific method. As an engineer, he would be more familiar with this than with sampling statistics (presuming his coursework looked like mine). What would a scientific survey look like there? Well, here's the scientific method in a flowchart (via Sciencebuddies.org):

So it seems plausible he was actually criticizing the polling being done, not the specific polling methodology. It's an important distinction, as all data must be analyzed on two levels: integrity of data, and integrity of concept. When discussing "randomness" in surveys, we must remember to acknowledge that there are two different levels going on, and criticisms can potentially have dual meanings.
It is thus with some interest that I realized that the Florida Congressman who is sponsoring the bill to eliminate the American Community Survey happens to share a name with the famous NH statesman. I have been following this situation since I read about it on the pretty cool Civil Statistician blog, run by a guy who runs stats for the census bureau.
Clearly there's some interesting debate going on here about data, analysis, role of the government, and the classic "good of the community vs personal liberty" debate.
I'm going to skip over most of that.
So why then, do I bring up Daniel Webster?
Well, I was intrigued by this comment from him , as reported in the NYT article on the ACS:
“We’re spending $70 per person to fill this out. That’s just not cost effective,” he continued, “especially since in the end this is not a scientific survey. It’s a random survey.”It was that last part of the sentence that caught my eye.
I was curious, first of all, what the background was of someone making that claim. I took a look at his website, and was pleased to discover that Rep. Webster is an engineer. It's always interesting to see one of my own take something like this on (especially since Congress only has 6 of his kind!).
That being said, is a random survey unscientific?
Well, maybe.
In grad school, we actually had to take a whole class on surveys/testing/evaluations, and the number one principal for polling methods is that there is no one size fits all. The most scientifically accurate way to survey a group is based on the group you're trying to capture. All survey methods have pitfalls. One very interesting example our professor gave us was the students who tried to capture a sample of their college by surveying the first 100 students to walk by them in the campus center. What they hadn't realized was that a freshman seminar was just letting out, so their "random" survey turned out to be 85% freshman. So over all, it's probably worse when your polling methodology isn't random than when it is.
There's all kinds of polling methods that have been created to account for these issues:
- simple random sampling - attempts to be totally random
- systematic sampling - picking say, every 5th item on a list
- stratified sampling - dividing population in to groups and then picking a certain percentage from each one (above this would have meant picking 25 random people from each class year)
- convenience sampling - grabbing whoever is closest
- snowball sampling - allowing sampled parties to refer/lead to other samples
- cluster sampling - taking one cluster of participants (one city, one classroom, etc) and presuming that's representative of the whole
There are others, though most subtypes off of these types (see more here).
So what does the ACS use?
As best I can tell, they use stratified sampling. They compile as comprehensive a list as they can, then they assign geocodes, and select from there. So technically, their sampling is both random and non-random.
Now, NYT analysis aside, I wonder if this is really what Webster was questioning. The other meaning one could take from his statement is that he was challenging the lack of scientific method. As an engineer, he would be more familiar with this than with sampling statistics (presuming his coursework looked like mine). What would a scientific survey look like there? Well, here's the scientific method in a flowchart (via Sciencebuddies.org):
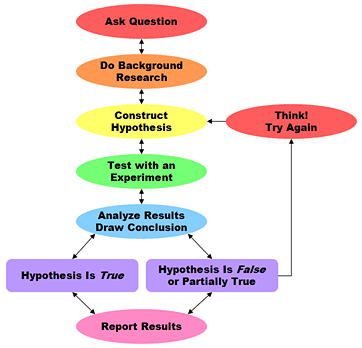
So it seems plausible he was actually criticizing the polling being done, not the specific polling methodology. It's an important distinction, as all data must be analyzed on two levels: integrity of data, and integrity of concept. When discussing "randomness" in surveys, we must remember to acknowledge that there are two different levels going on, and criticisms can potentially have dual meanings.
Monday, May 7, 2012
Who represents you best?
Another day, another infographic:
![]()
Via: TakePart.com
Sigh. It's an election year, so I know I'm going to be seeing a lot of these types of things and I should just get over it but...I can't.
I really dislike this one, because while the data may be good (I haven't checked it), I think the premise is all wrong and perpetuates faulty ideas.
Congress is a nationally governing body that is split up by state. Thus, even if Congress was perfectly representative on a state to state basis, it would still very likely not look like the USA as a whole.
For example, let's take Asian Americans and Pacific Islanders. According to the census bureau, 51% of this demographic lives in just 3 states: California, New York and Hawaii. Nine states pull fewer than 1% of their population from this demographic: Alabama, Kentucky, Mississippi, West Virginia, North Dakota and South Dakota, Montana, Wyoming and Maine. 4.2% may be the national average, but Hawaii is 58% Asian, and West Virginia is 0.7% Asian. For one, it would be ethnically representative to have at least half of their reps be Asian every year, for the other it's statistically unlikely to happen.
If you wanted a really impressive infographic, you'd take each state's individual ethnic breakdown and cross reference it with how many representatives they had in Congress to figure out what a representative sample should be. Adding those up would give you the totals for racial diversity when judged on a state level, not a national level.
Of course, that's only the racial numbers, though the same could apply to the religion questions. This doesn't work for the gender disparity...gender ratios are pretty close to 50/50 (Alaska has the highest percentage of men, Mississippi has the lowest). I think that's a more complex issue, since you have to take in to account the number of women desiring to run for office (lower than men), and then the counterargument that fewer women want to run because they believe they're less likely to win or more likely to be crticized. It's a tough call how many women there should be to be truly representative since both sides can argue the data.
The income, age, and education numbers I'd argue are all due to the nature of the job. Campaigning is expensive, and neither Representative nor Senator are not exactly entry level jobs.
As the comments from yesterday's post showed, one of the least representative parts of Congress is profession. Lawyers make up 0.38% of the population, and yet 222 members of Congress have law degrees (38% of the House, 55% of the Senate). That seems highly unrepresentative right there.
At the end of the day, we vote for people who represent our state, not necessarily our gender, religion or race. In Massachusetts, our current Senate race is between a 52 year old white male lawyer and a 62 year old white female lawyer. The biggest difference demographically in my eyes? One has lived in Massachusetts for decades, and the other....lived here long enough to qualify to run. No one's going make a pretty picture out of that factor, but it's pretty important when it comes to getting adequately represented.
Via: TakePart.com
Sigh. It's an election year, so I know I'm going to be seeing a lot of these types of things and I should just get over it but...I can't.
I really dislike this one, because while the data may be good (I haven't checked it), I think the premise is all wrong and perpetuates faulty ideas.
Congress is a nationally governing body that is split up by state. Thus, even if Congress was perfectly representative on a state to state basis, it would still very likely not look like the USA as a whole.
For example, let's take Asian Americans and Pacific Islanders. According to the census bureau, 51% of this demographic lives in just 3 states: California, New York and Hawaii. Nine states pull fewer than 1% of their population from this demographic: Alabama, Kentucky, Mississippi, West Virginia, North Dakota and South Dakota, Montana, Wyoming and Maine. 4.2% may be the national average, but Hawaii is 58% Asian, and West Virginia is 0.7% Asian. For one, it would be ethnically representative to have at least half of their reps be Asian every year, for the other it's statistically unlikely to happen.
If you wanted a really impressive infographic, you'd take each state's individual ethnic breakdown and cross reference it with how many representatives they had in Congress to figure out what a representative sample should be. Adding those up would give you the totals for racial diversity when judged on a state level, not a national level.
Of course, that's only the racial numbers, though the same could apply to the religion questions. This doesn't work for the gender disparity...gender ratios are pretty close to 50/50 (Alaska has the highest percentage of men, Mississippi has the lowest). I think that's a more complex issue, since you have to take in to account the number of women desiring to run for office (lower than men), and then the counterargument that fewer women want to run because they believe they're less likely to win or more likely to be crticized. It's a tough call how many women there should be to be truly representative since both sides can argue the data.
The income, age, and education numbers I'd argue are all due to the nature of the job. Campaigning is expensive, and neither Representative nor Senator are not exactly entry level jobs.
As the comments from yesterday's post showed, one of the least representative parts of Congress is profession. Lawyers make up 0.38% of the population, and yet 222 members of Congress have law degrees (38% of the House, 55% of the Senate). That seems highly unrepresentative right there.
At the end of the day, we vote for people who represent our state, not necessarily our gender, religion or race. In Massachusetts, our current Senate race is between a 52 year old white male lawyer and a 62 year old white female lawyer. The biggest difference demographically in my eyes? One has lived in Massachusetts for decades, and the other....lived here long enough to qualify to run. No one's going make a pretty picture out of that factor, but it's pretty important when it comes to getting adequately represented.
Tuesday, May 1, 2012
Everybody loves a (certain sort of) hypocrite
Last week I posted my annoyance at studies that put more work in to proving that substitute a potential proximal cause for the real issue without adequately proving that was a valid substitution. At the time I was talking about food deserts, but today I found another great example. A study that has gone viral links homophobic behavior with secret homosexual desires.
Now, when I first heard these results in passing, I was pretty surprised. I spent years in a Baptist school with plenty of people who were quite clear about their homophobia, and I have always thought it overly simplistic when people say that's all repressed homosexuality. I think the reasons behind any prejudice are likely to be complicated and multifaceted. Plus, the logic seemed pretty sensationalistic.....and after all, we don't accuse misogynists of wanting to be women.
Anyway, I hadn't had time to look in to this study, but I ran across this takedown by Daniel Engber on Slate today. I thoroughly enjoyed the article (and extra credit to Slate for not being 100% PC). The author points out that the results of this study are only as trustworthy as the semantic association method (the implicit association test) they used to prove it. This technique, which essentially involves showing a subliminal message followed by a picture, can be questionable. From the Slate article:
The other issue that Engber didn't mention is that this study was performed on college freshmen. I REALLY hate when people generalize from that age group because....stop me if I'm getting crazy here...I am pretty sure kids that age have a less well developed sense of identity than the adult population at large.
Even if the data were 100% accurate, I think that the youngness of this sample would skew the results. At least when I went to college, quite a few kids came out during that time, and it was a time of questioning identity for pretty much anyone. According to the best research I could find, the average gay person doesn't even self-identify as gay until 16, and the majority of people come out either in college or after developing an independent life. So the chances that expressions of sexual identity, especially subconscious expressions, may look different at 18-20 is pretty well supported.
Now I'm pretty sure there will always be Ted Haggard's or Larry Craig's in this world...just like there will always be John Edwards or Elliot Spitzer's. Sex, gay or straight, will always capture headlines more than boring things like tax evasion, even though they are both hypocritical. Still, with studies like this, I urge caution. Accepting the result means accepting that words on a screen and hundreths of a second of reaction time can accurately capture homophobia, and that a 19 year olds perspective on the world can translate to all adults. If you believe both of those, then go ahead and quote the study. Otherwise, you may want to hold your judgement for a bit longer.
Now, when I first heard these results in passing, I was pretty surprised. I spent years in a Baptist school with plenty of people who were quite clear about their homophobia, and I have always thought it overly simplistic when people say that's all repressed homosexuality. I think the reasons behind any prejudice are likely to be complicated and multifaceted. Plus, the logic seemed pretty sensationalistic.....and after all, we don't accuse misogynists of wanting to be women.
Anyway, I hadn't had time to look in to this study, but I ran across this takedown by Daniel Engber on Slate today. I thoroughly enjoyed the article (and extra credit to Slate for not being 100% PC). The author points out that the results of this study are only as trustworthy as the semantic association method (the implicit association test) they used to prove it. This technique, which essentially involves showing a subliminal message followed by a picture, can be questionable. From the Slate article:
Should we trust this interpretation of the data? In the Times op-ed, the authors claim that the reaction-time task "reliably distinguishes between self-identified straight individuals and those who self-identify as lesbian, gay or bisexual." Their formal write-up of the work for the Journal of Personality and Social Psychology is a bit less sanguine on the method, citing just one other study that has used this approach, and saying it "showed moderate correspondence with participants’ self-reported sexual orientation."So there's that.
The other issue that Engber didn't mention is that this study was performed on college freshmen. I REALLY hate when people generalize from that age group because....stop me if I'm getting crazy here...I am pretty sure kids that age have a less well developed sense of identity than the adult population at large.
Even if the data were 100% accurate, I think that the youngness of this sample would skew the results. At least when I went to college, quite a few kids came out during that time, and it was a time of questioning identity for pretty much anyone. According to the best research I could find, the average gay person doesn't even self-identify as gay until 16, and the majority of people come out either in college or after developing an independent life. So the chances that expressions of sexual identity, especially subconscious expressions, may look different at 18-20 is pretty well supported.
Now I'm pretty sure there will always be Ted Haggard's or Larry Craig's in this world...just like there will always be John Edwards or Elliot Spitzer's. Sex, gay or straight, will always capture headlines more than boring things like tax evasion, even though they are both hypocritical. Still, with studies like this, I urge caution. Accepting the result means accepting that words on a screen and hundreths of a second of reaction time can accurately capture homophobia, and that a 19 year olds perspective on the world can translate to all adults. If you believe both of those, then go ahead and quote the study. Otherwise, you may want to hold your judgement for a bit longer.
Thursday, April 12, 2012
Age Bias and Polling Methods
A few years ago, in one of my research methods classes in grad school, a professor I had asked us to raise our hand if we had a cell phone.
Everyone raised their hands.
Then he asked people to keep their hands up if they had a land line as well.
Many hands went down.
For those left, he asked how many answered it regularly or had caller ID and screened calls.
Pretty much everyone.
This of course then led in to a discussion of political polling and how many of us had ever considered who was actually answering these questions. It was an interesting discussion, as pretty much the entire class admitted they would have self excluded. The Pew Research center suggests this was not an anomaly, and that this is actually a problem that's becoming more acute in political polling.
While many large national polling organizations have started calling cell phones as well, on the state level this is not often corrected for. This can, and has, resulted in some inaccurate polls, as the sample of people home, with a landline, willing to answer a pollsters call, does not always reflect the general population. Actually, I think there's good reason to question the representativeness of a sample willing to answer their phone for an unknown number, but that could be disputed (those interested enough to pick up the phone also might be more likely to actually go vote).
Anyway, none of this is new. What is new this (presidential) election cycle is that news organizations are now starting to put up stats on Twitter and Facebook status updates. I decided to take a look and see exactly how skewed these stats are, and found that Twitter is most popular in the 18-29 demographic. Of course, this is the least likely demographic to actually vote. Interestingly, the poll on Twitter usage did not include people under 18, but these are not excluded when they are compiling trends.
So two different ways of tracking elections, two different sets of flaws. Pick your poison.
Wednesday, April 4, 2012
Opinions, everybody's got one
I was listening to a management podcast recently where a man named John Blackwell was being interviewed. He was talking about how he was constantly reading things about how the whole workplace was changing, but he was getting curious as to why he felt like the companies he worked with weren't reflecting this. When he tried to investigate, he found out that the ongoing surveys commonly used in British management journals (can't find a link) were being done on the "up and coming business leaders". When he looked in to what that meant, he realized it was people who were second year MBA students.
The problem with this, of course, was that this was asking people not in the workforce what the workforce was going to look like 10 years from now. They found, not surprisingly, that young people in grad school tend to be very optimistic about things like "working from home" or "flex time" when they're in school, but when they got in to business, they towed toed the line. Thus, every survey done was essentially useless.
This all reminded me of a conversation I got in to several years ago when I was working the overnight shift. Someone had brought in a magazine (People or Vogue or something like that) and they had a ranking of the 100 most beautiful women in Hollywood. Drew Barrymore was number one that year, and one of my (young, male) coworkers was actively scoffing at that. "She's unattractive," he stated definitively. "All the guys I know think so too."
Now, I was feeling a little feisty feminist that night, so I thought about how to challenge him on that. Leaving aside that "Hollywood unattractive" would still turn heads in any average crowd (and be more attractive than any girl he'd dated), something about his comment irked my data side. "So maybe the voting was done by women," I replied.
He was floored.
I noted that it was not a men's magazine that ran the story, so really women's opinions of other women's attractiveness would actually be more relevant to this list. Furthermore, as most of the leading women in Hollywood make their money on romantic comedies, professionally women's opinions of their attractiveness (which presumably included a certain likeability factor) would actually matter more than men's.
I was fascinated that this clearly disturbed him. It had clearly never occurred to him that straight men may not be the target audience for female attractiveness, or even that the relevance of his opinion might get questions. He wasn't trying to be a jerk, he was legitimately confused at the whole idea.
A long intro, but the bigger point is important. In any opinion survey or research, it's important to figure out whose opinion is most relevant to what you're trying to get at and why. When it comes to law and public policy questions, I think every voter is relevant. When it comes to workplace trends? You may need to narrow your sample.
Sampling bias is a huge problem in many contexts, but my primary one for today's post is when the survey was not conducted with the end in mind. For any sample, you have to figure out how much your subject's opinions actually matter given what you're trying to find out. In social conversation it may be interesting to find out what a particular person thinks of a topic, but for good data, show me why I care.
Subscribe to:
Posts (Atom)